
The top command provides updatable snapshots of the status of processes and comes installed by default with the procps-ng package. Normally it is used in interactive mode (although it can be used in batch mode with the -b flag) and called with a delay and a number of desired iterations. If neither are passed as arguments, the delay will be around 3 seconds and it will iterate indefinetely.
marc:~> top -d 5 -n 1000 → refreshes the output every 5 seconds a 1000 times
marc:~> top -d 10 → refreshes the output every 10 seconds forever
marc:~> top → refreshes the output every 3 seconds forever
We can invoke top with the “-u” flag to monitor just some user’s processes or to ignore them:
marc:~> top -d 5 -u marc → show just marc’s processes
marc:~> top -d 5 -u !root → show all but root’s processes
We can invoke it with the “-o” flag to determine the order and with “-p” to monitor just a few PIDs:
marc:~> top -u marc -o +VIRT → sort marc’s processes by virual memory desc
marc:~> top -p 1,2,3,4,5 → monitors only the given PIDs
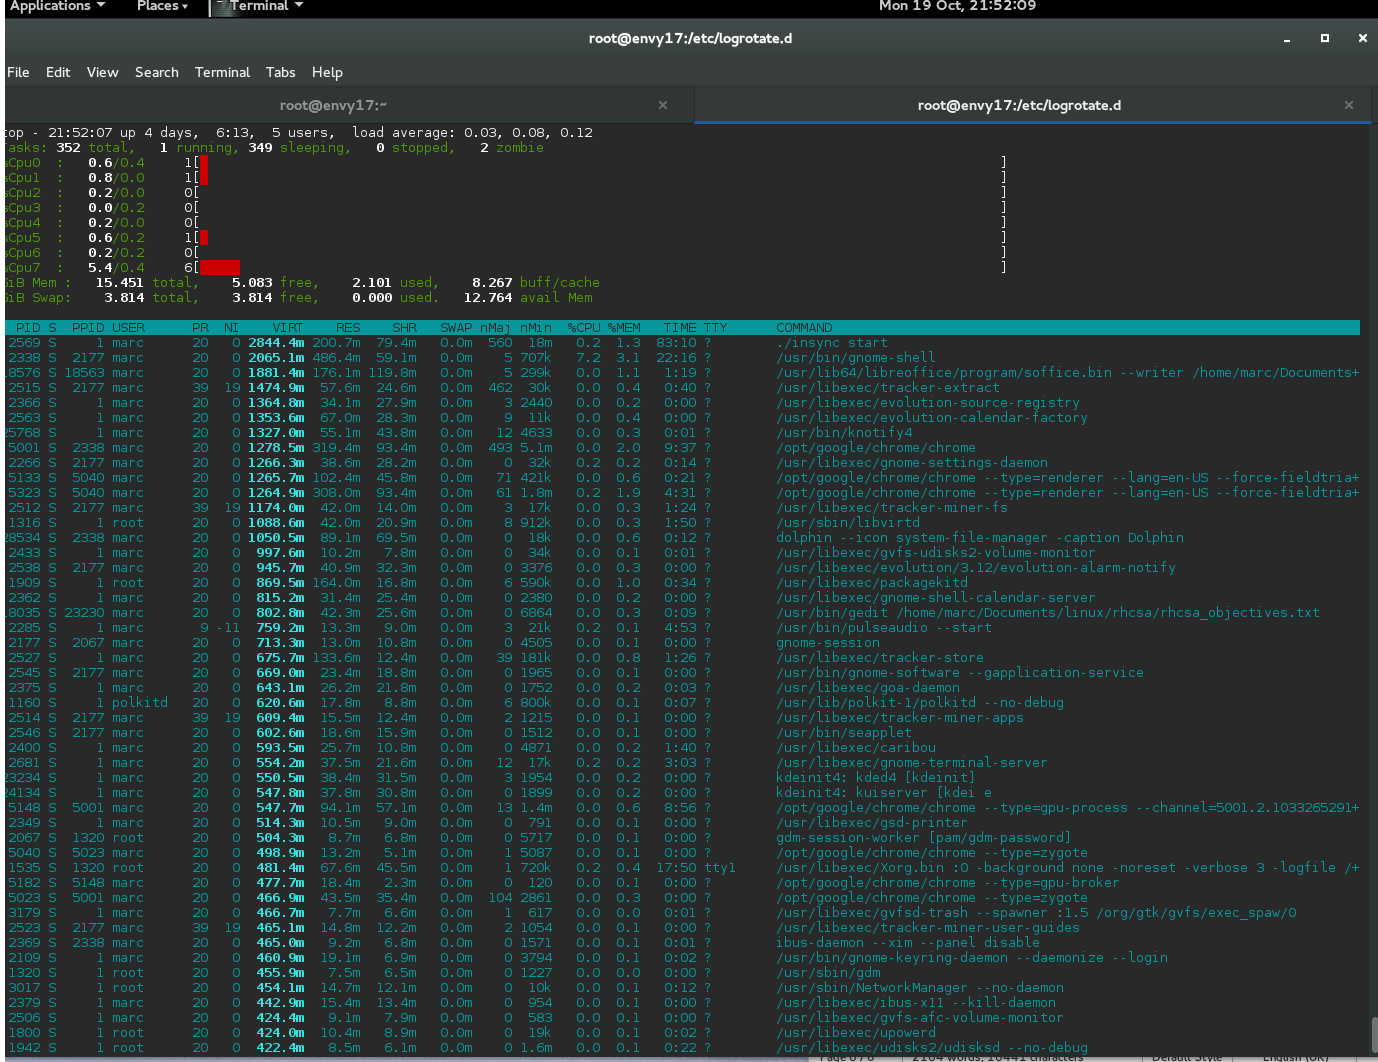
top 14:04:33 up 3 days, 22:25, 5 users, load average: 0.13, 0.12, 0.13
Tasks: 364 total, 1 running, 361 sleeping, 0 stopped, 2 zombie
%Cpu(s): 4.3 us, 1.5 sy, 0.0 ni, 93.6 id, 0.6 wa, 0.0 hi, 0.0 si, 0.0 st
KiB Mem : 16201988 total, 5072624 free, 2409272 used, 8720092 buff/cache
KiB Swap: 3999740 total, 3999740 free, 0 used. 13083960 avail Mem
.
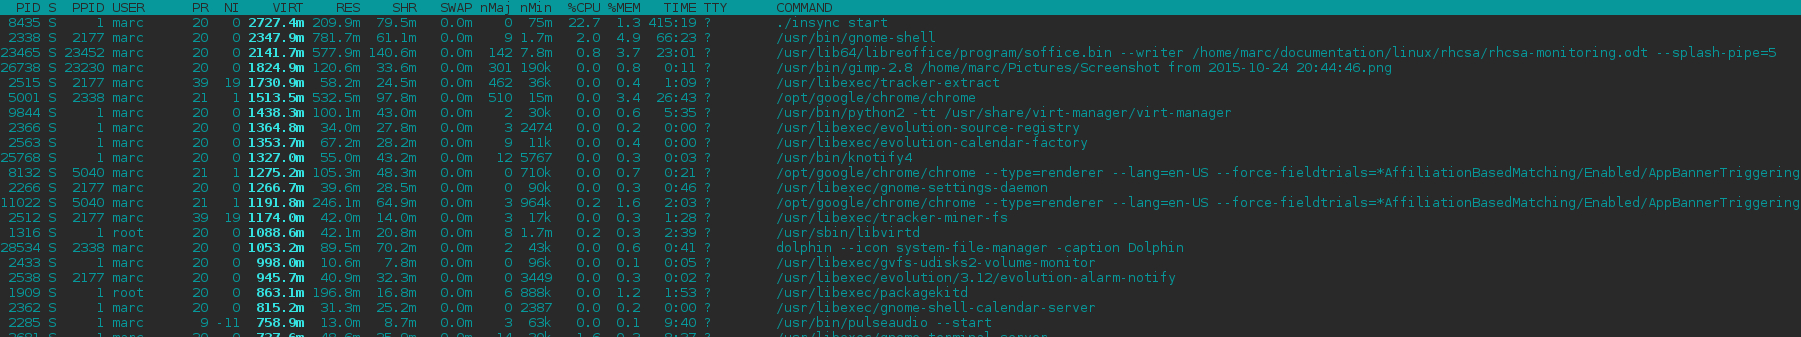
PID USER PR NI VIRT RES SHR S %CPU %MEM TIME+ COMMAND
11017 marc 20 0 1369112 127776 43916 S 3.1 0.8 9:27.34 virtmanager
2338 marc 20 0 2099008 446944 62560 S 2.3 2.8 20:01.49 gnomeshell
1535 root 20 0 537792 87956 63252 S 2.1 0.5 16:33.80 Xorg.bin
2681 marc 20 0 567228 38000 22168 S 1.8 0.2 2:29.04 gnometerminal
1160 polkitd 20 0 635448 18268 8964 S 1.3 0.1 0:06.98 polkitd
1111 dbus 20 0 122276 5128 3340 S 0.8 0.0 0:24.74 dbusdaemon
5001 marc 20 0 1303040 324288 95772 S 0.8 2.0 9:15.71 chrome
22078 marc 20 0 146824 4308 3380 R 0.8 0.0 0:00.03 top
1 root 20 0 189752 9992 5284 S 0.3 0.1 0:25.30 systemd
7 root 20 0 0 0 0 S 0.3 0.0 0:32.85 rcu_sched
11 root rt 0 0 0 0 S 0.3 0.0 0:00.17 migration/0
786 root 51 0 0 0 0 S 0.3 0.0 5:02.64 irq/32iwlwifi
1077 root 16 4 49056 3188 2836 S 0.3 0.0 0:00.21 auditd
1098 root 20 0 4364 1376 1284 S 0.3 0.0 1:01.18 rngd
1134 root 20 0 324140 28088 10876 S 0.3 0.2 0:00.61 firewalld
1316 root 20 0 1114708 42804 21176 S 0.3 0.3 1:48.30 libvirtd
1909 root 20 0 890324 167944 17204 S 0.3 1.0 0:34.09 packagekitd
2292 marc 20 0 178780 4896 4156 S 0.3 0.0 0:00.17 dconfservice
2400 marc 20 0 606080 24424 11088 S 0.3 0.2 1:32.07 caribou
2569 marc 20 0 2912684 205712 81328 S 0.3 1.3 82:49.93 insync
3017 root 20 0 465048 15092 12436 S 0.3 0.1 0:10.07 NetworkManager
3179 marc 20 0 477872 7888 6780 S 0.3 0.0 0:01.21 gvfsdtrash
Once we are in interactive mode we can use a multitude of keys to modify the output:
-
Keys Action
<, > “the larger than” and “smaller than” keys move left/right the sort column
1 or 2 switch 3rd line between CPU summary or per CPU statistics
A toggle between a full screen and a 4way split screen
B toggle bold lines on/off
c toggle between short and long command format
d <integer> changes the refresh delay
E toggles the memory in the Summary area between: K, M, T, P & Exabytes.
e same as above but in the Task area
f enters field management mode = we can choose what fields to show and their order
g gives us 4 choices as to the Task area layout
H toggles between process and thread mode
i toggles between normal and idle mode (where idle procs/threads are not shown)
J left/right justify numeric data in the Task area
j left/right justify character data in the Task area
k kill a process by typing its PID in the kill prompt
L and & search a string with L and repeat search with &
l show/hide the 1 st line showing uptime and average load
m toggles between 4 different memory outputs modes
n <integer> show <integer> maximum of processes/threads
o filter: “PID>9”, “VIRT>1000000” (memory shown in Kb!) or “nMin>1000”
q quit
r renice a process by typing its PID and the renicing value
S toggles cumulative time on/off (on → time of process + its forked children)
s same as d
t toggle the 3 rd line (%Cpu) between text and graphic mode
u user whose processes we want to monitor
V toggle between normal and tree mode
W save the current configuration to ~/.toprc
x switch on/off bold for sort column
Y inspect the filehandles and memory mappings of a process
Z change colors if the Summary, Task and Headers
z toggle colours on/off
= cancel the options i, n, u/U and o/O
When we use top for the first time it is wise to play around with the layout options until the screen looks very much to our liking. For instance, pressing the keys 1, 2, E, l, m, t, Z and z I get a layout like …

As regards the task or lower frame, we can play with the keys B, c, d, e, f, g, H, i, J, j, n, S, V, x, Z and z until we get to like it best.
Once we are happy with it we should press W to save the customisation in the file ~/.toprc . Next time we start top with the current user we should get the same settings we just set.