
The tool htop is very similar in functionality to the traditional top and its alternative atop, but it has some added features (see below) that make it my preferred process monitoring tool.
As htop does not come installed by default so we’ll have to dnf it:
# dnf -y install htop
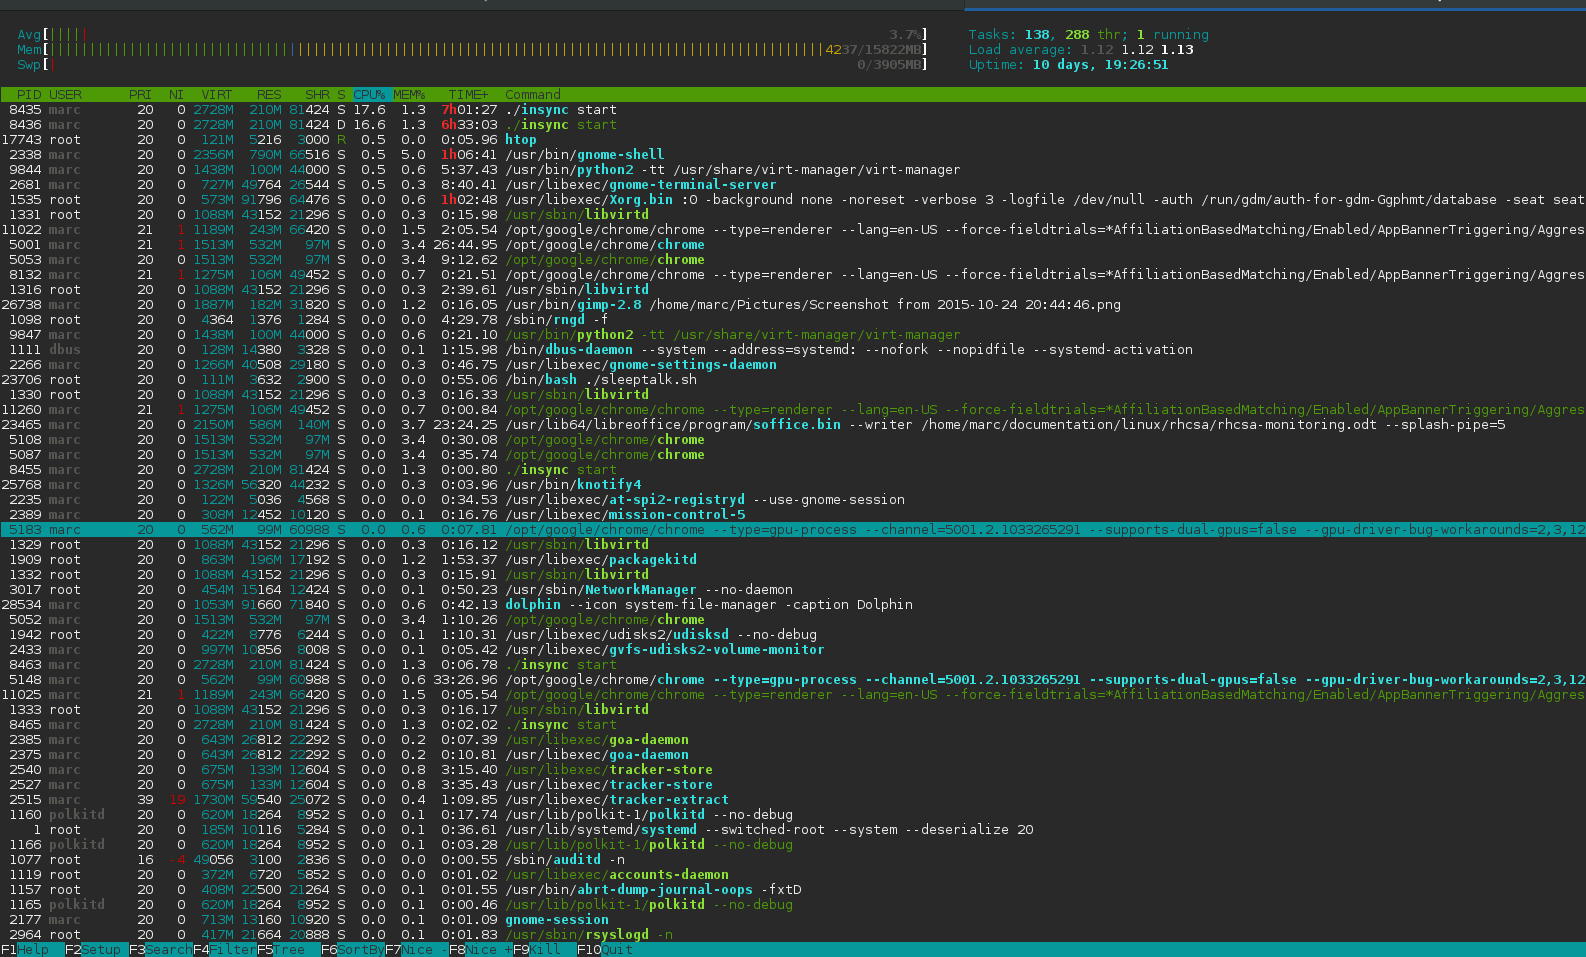
As we can see above the layout might be a bit nicer and the menu is far more intuitive. I suggest pressing F2 to customise the layout to suit your taste.
We can also search (F3), filter (F4), toggle tree view on/off (F5), sort (F6), kill (F9), renice (F7 & F8), list filehandles (pressing l) and trace syscalls with strace for a tagged process (pressing s). To tag one or multiple processes we have to hover over them and press the Space bar. To untag one or all, we should press U.
If we have enabled tree view, we can expand and collapse the different process trees with “+” and “–”.
We can press P, M & T to sort by processing time, memory usage and starting time respectively. When sorting, we can switch between ascending and descending order pressing I.
We can hide kernel threads by pressing K and user threads with H.
We can press u to show a particular user’s processes/threads and we can type a number + Enter and that process line should be tagged.
Finally, we can quit htop pressing either F10 or q.